Building the report is the hard part.
Every new question means another table to build, another export to reconcile — slow, manual work, and the result still doesn't quite answer what you asked.

Business Intelligence AI+
Real-time dashboards, self-service reports, and an AI analyst that answers in plain language — all on the same platform as your sales, service, and marketing data. No warehouse to build. No export to wait on.
Three reasons dashboards stop short of an answer.
Every new question means another table to build, another export to reconcile — slow, manual work, and the result still doesn't quite answer what you asked.
The metric moved, but the reason is buried three drill-downs deep. Seeing the what is easy; understanding the why is not.
To get past the surface, someone has to sit down and dig — so insight is gated behind the analytics queue, and the people closest to the business can't answer their own questions.
Dashboards are table stakes. The value is in the answer — and how fast anyone in the business can get to it.
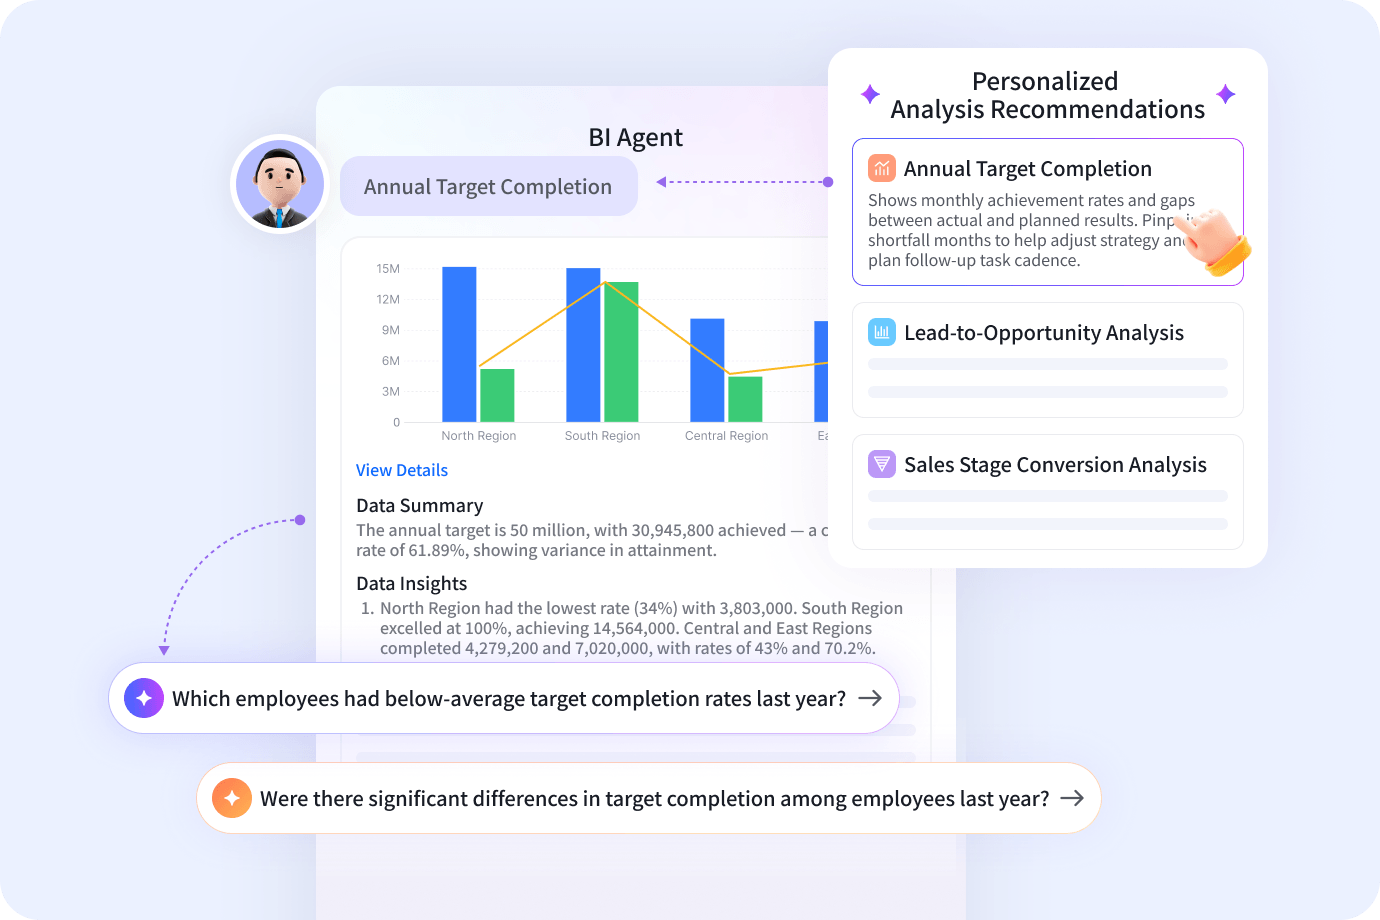
Conversational analytics
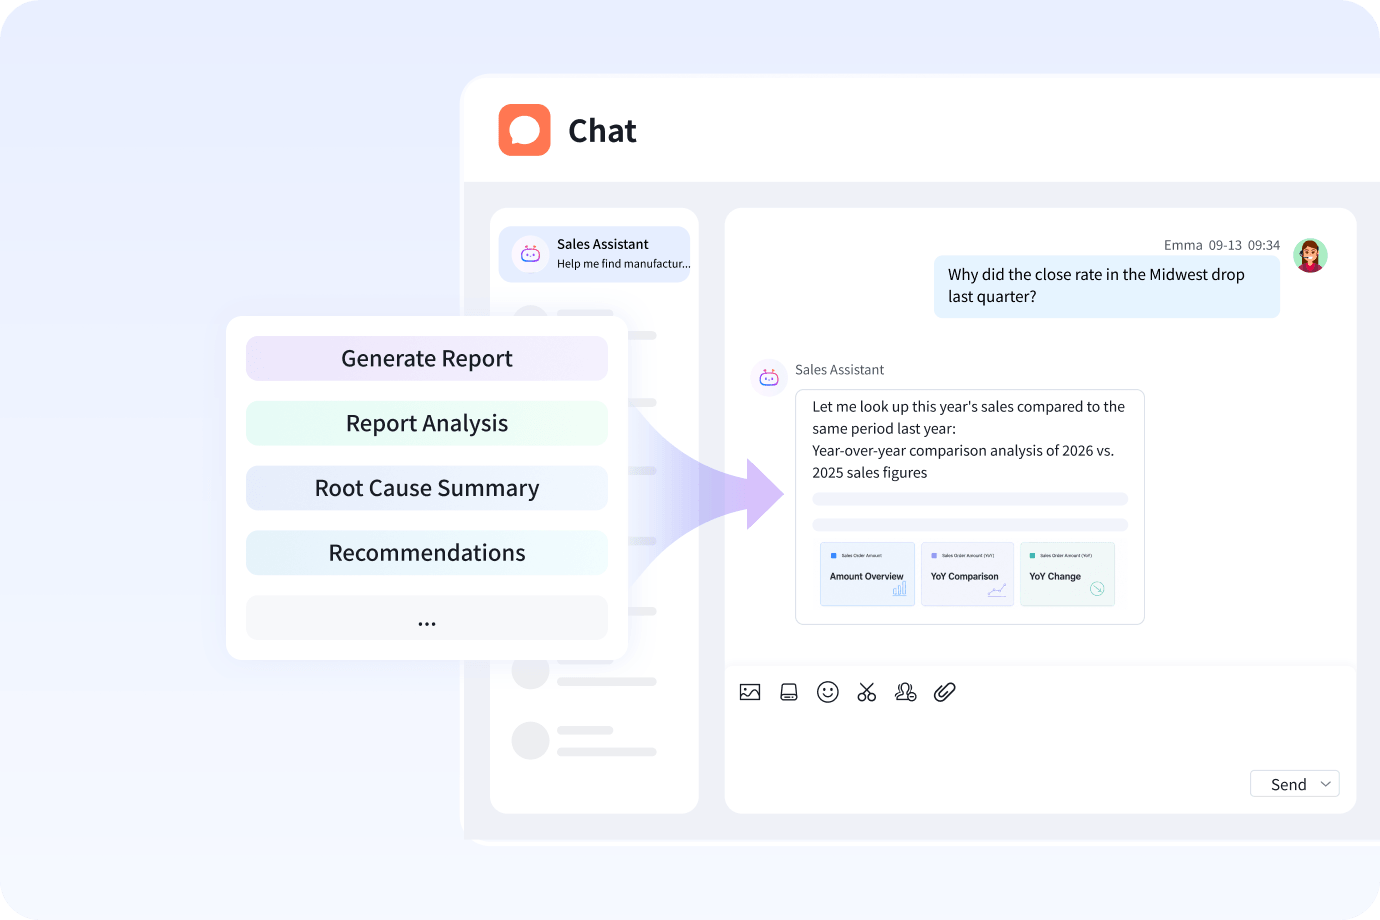
Type it the way you'd say it — “Why did close rates drop last quarter in the Midwest?” — and the AI analyst queries your live CRM data, builds the chart, and hands back a decision-ready answer with the underlying records cited.
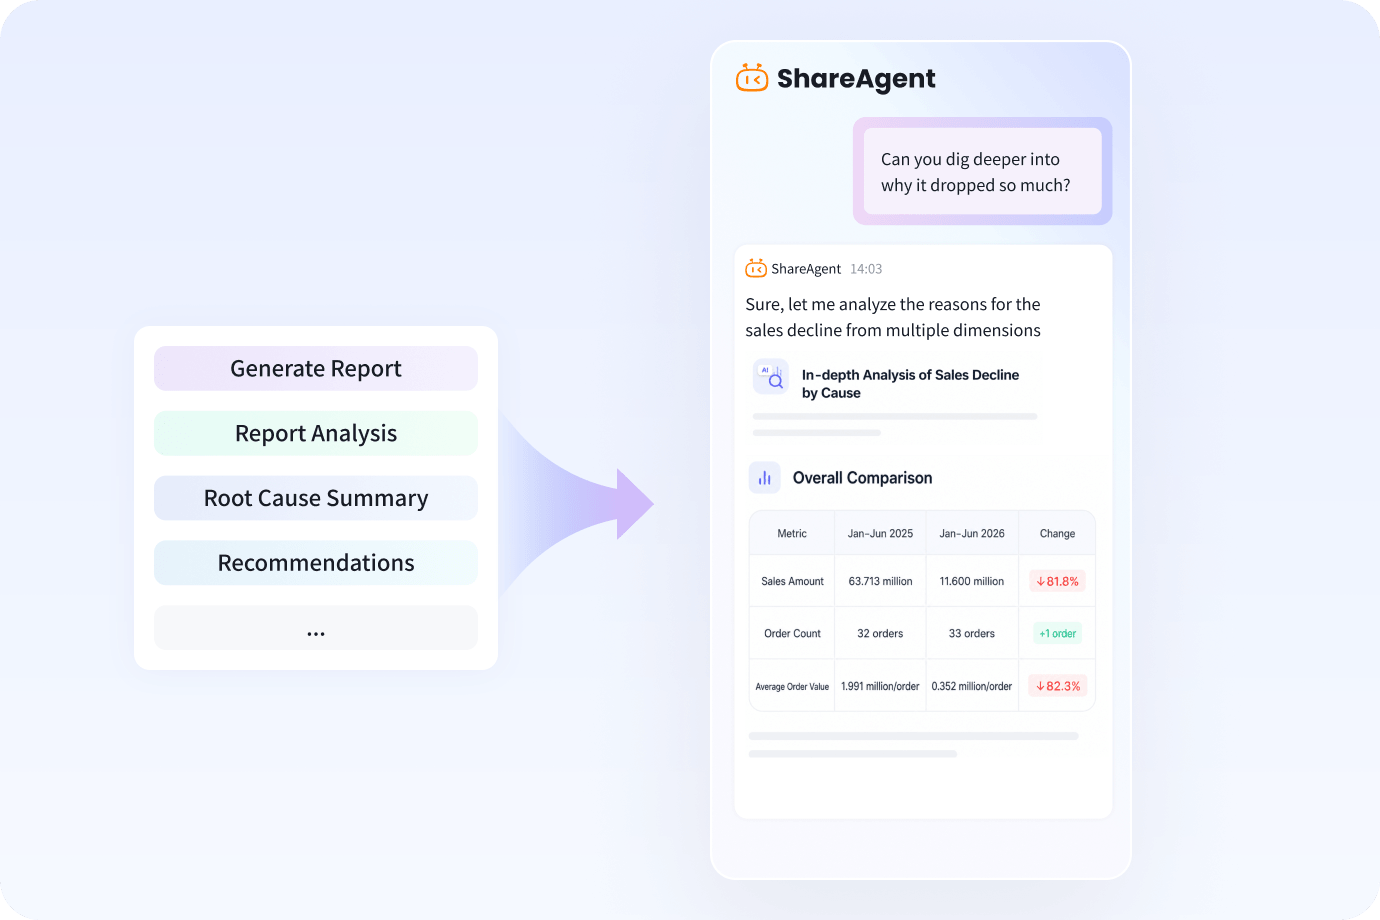
Anomaly & root-cause
AI watches your key metrics, flags anomalies before you go looking, traces them to the underlying driver, and recommends the next action — so a dip becomes a decision, not a mystery.
Self-service analysis
Drag-and-drop designer with prebuilt themes and chart templates, exploratory drill-down, and period-over-period and cross-metric calculations. Business users answer their own questions; the analytics team gets its time back.
Embedded analytics
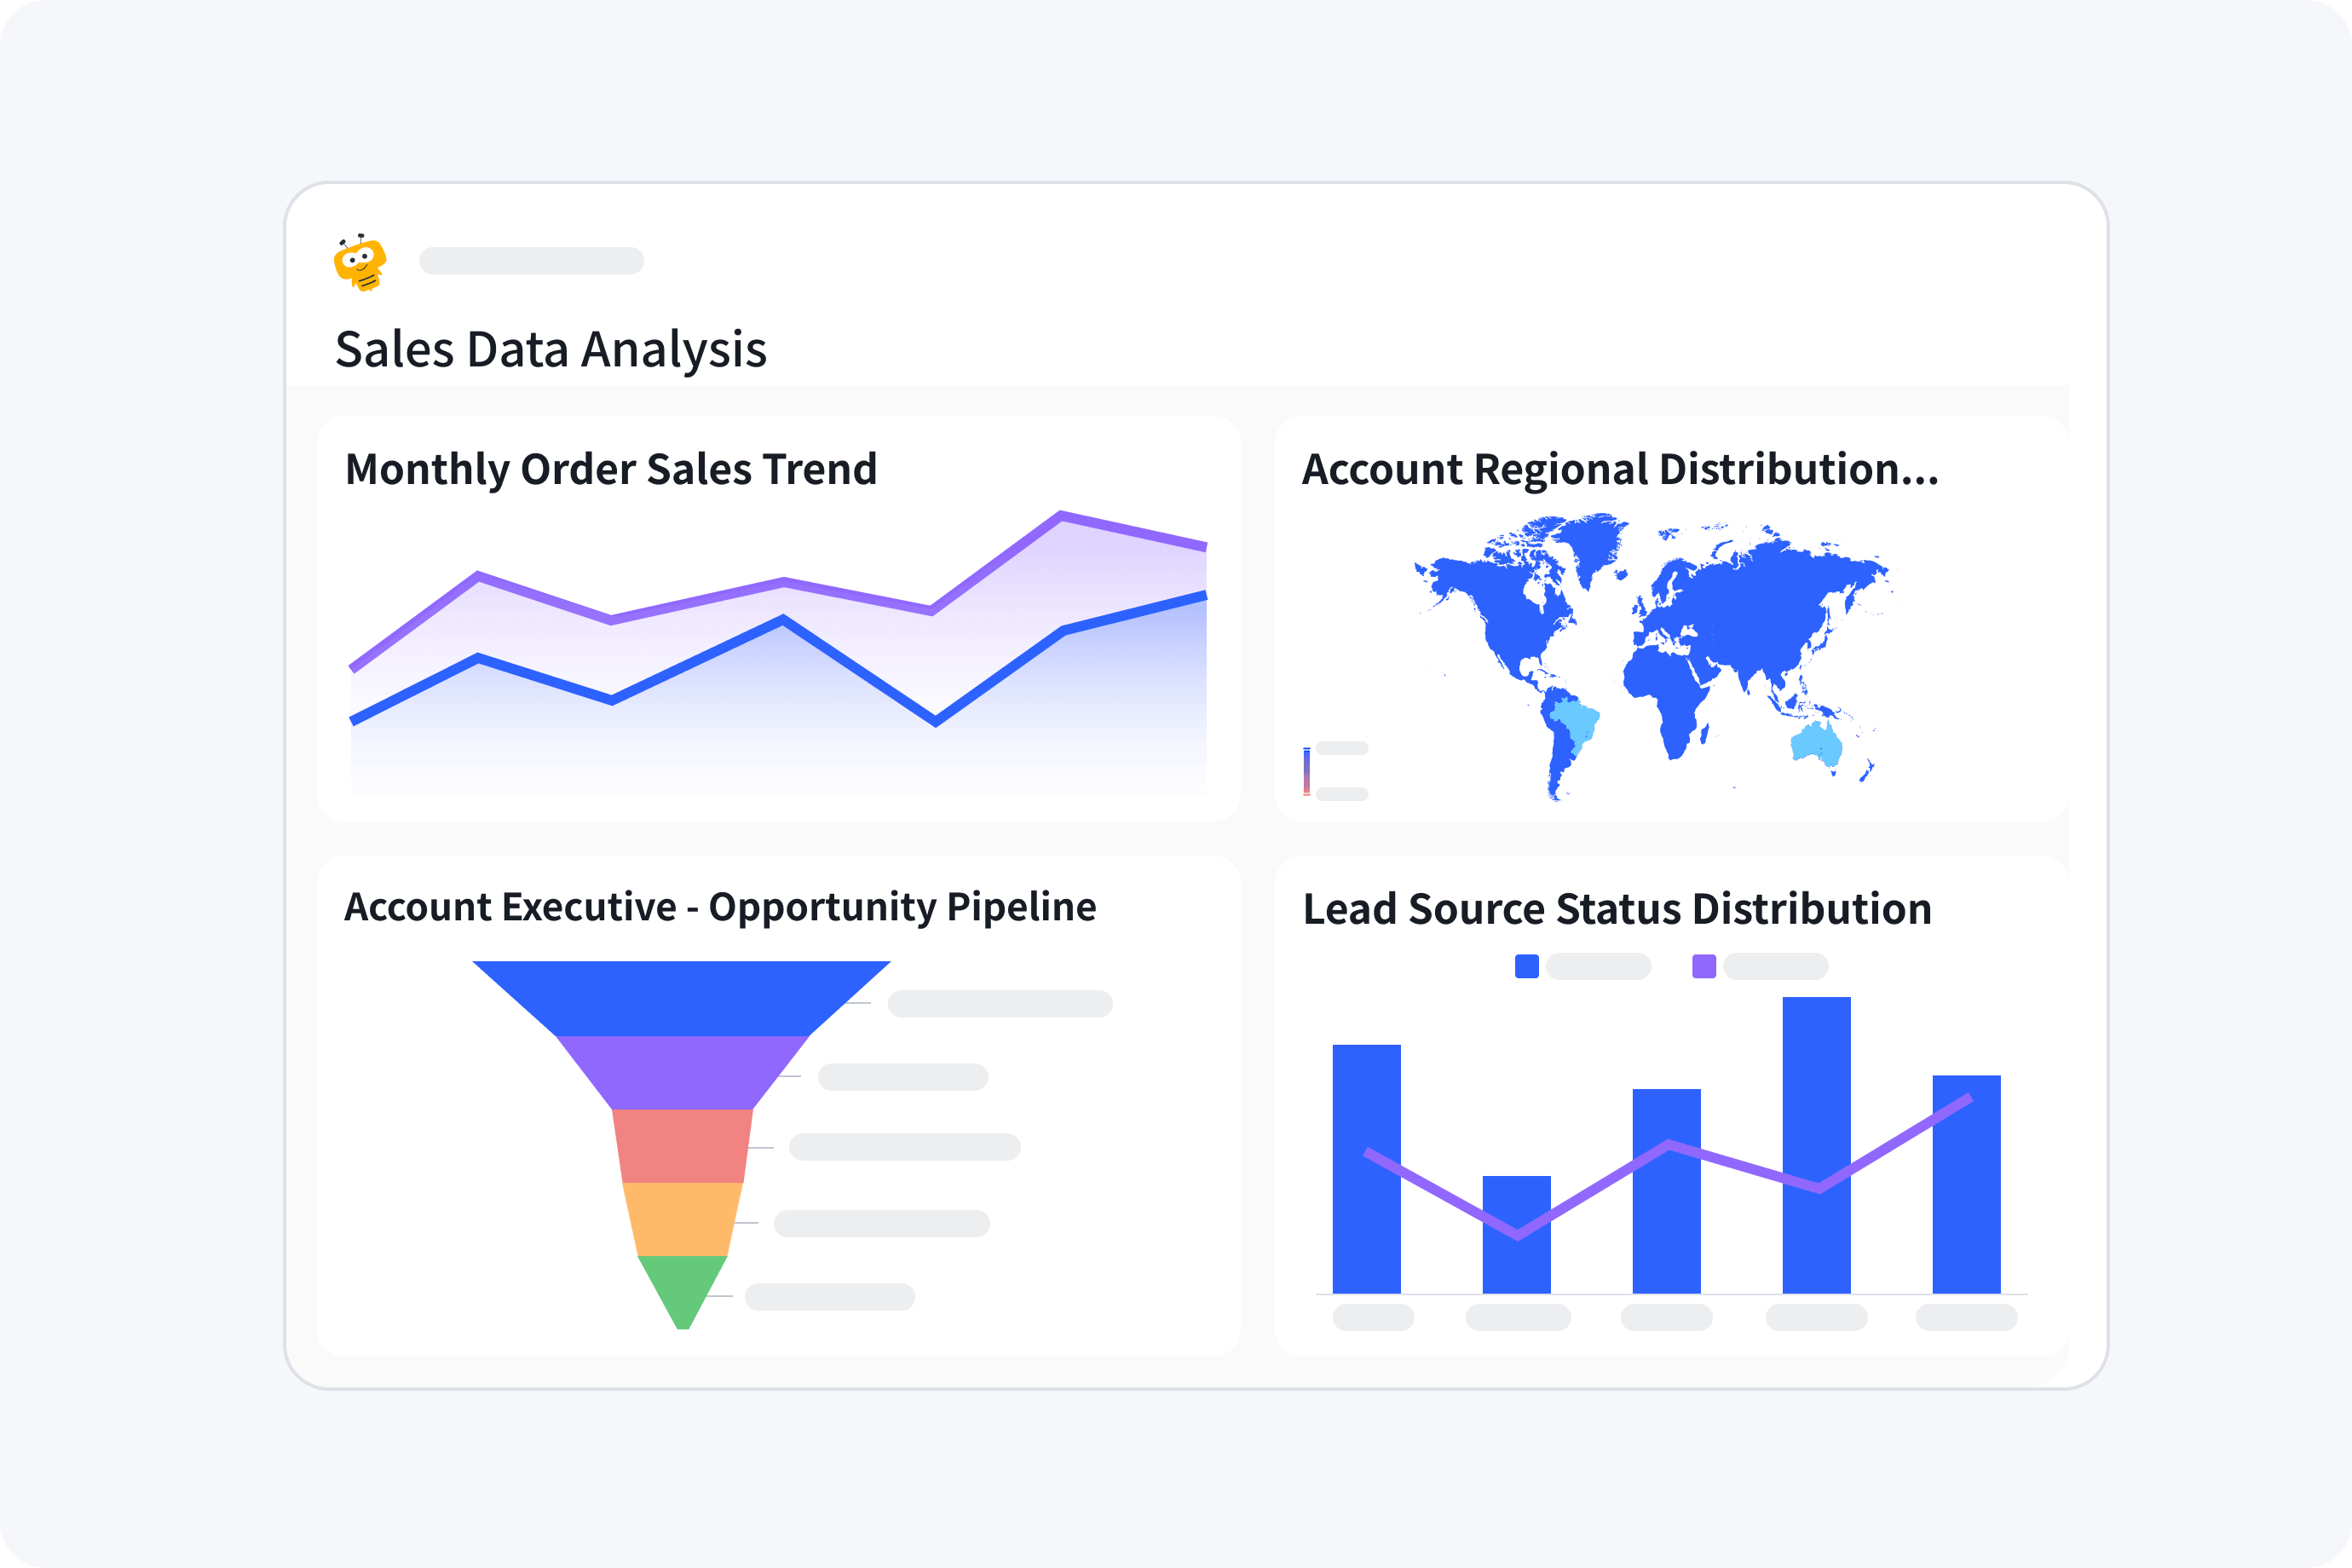
Prebuilt analytics for marketing, sales, service, and channel, surfaced right on the home page, list views, and record details. Real-time data cockpits for the leadership screen; the same insight in the record a rep is working. One data model, everywhere.
Goal management
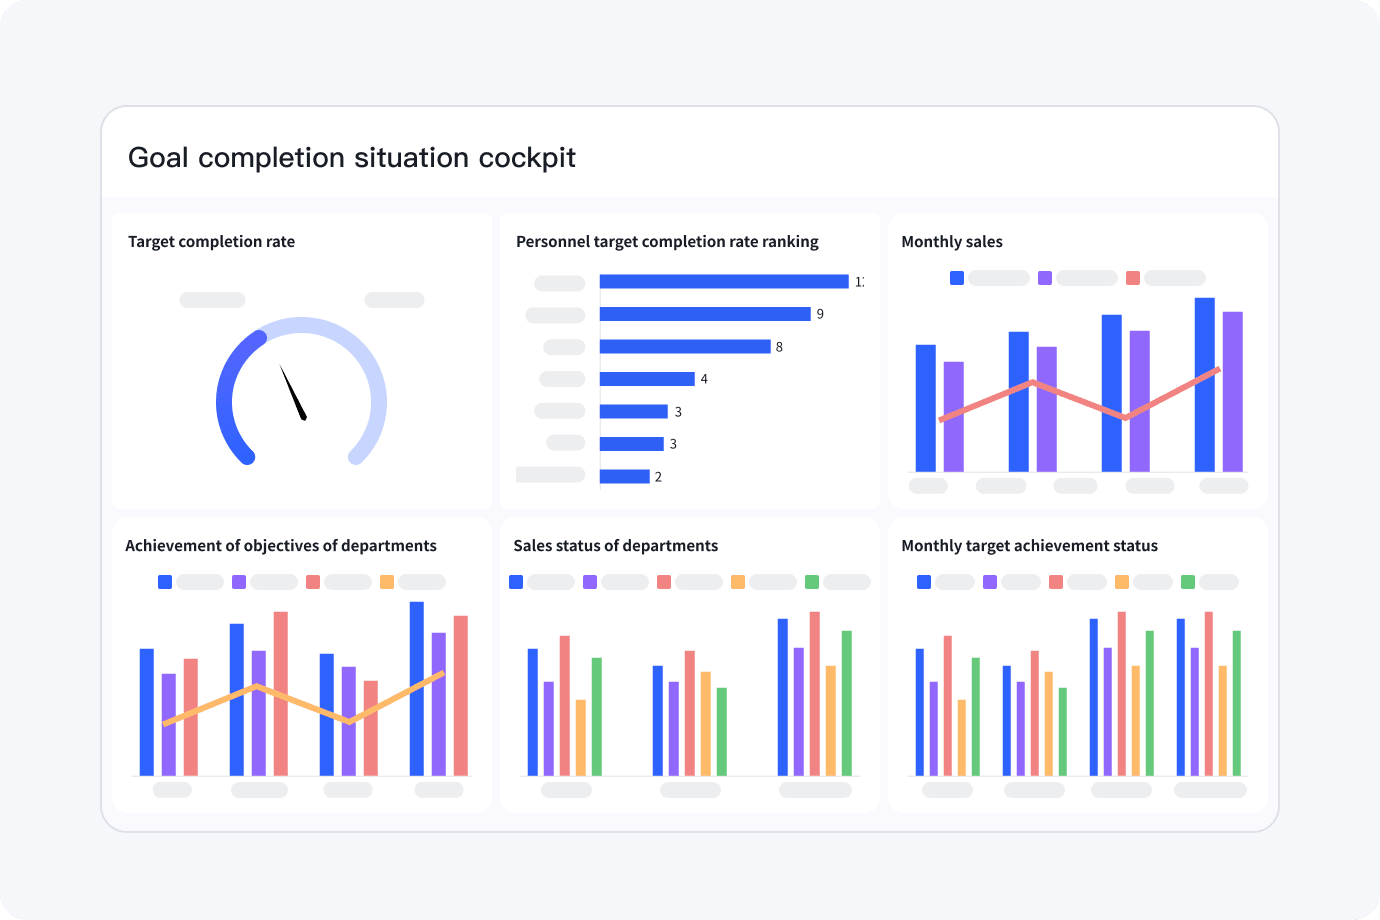
Set goals by team, rep, product, region, or partner; track target-vs-actual live, with period-over-period and year-over-year comparison built in. Everyone sees where they stand without waiting for the end-of-month report.
Permissions & sharing
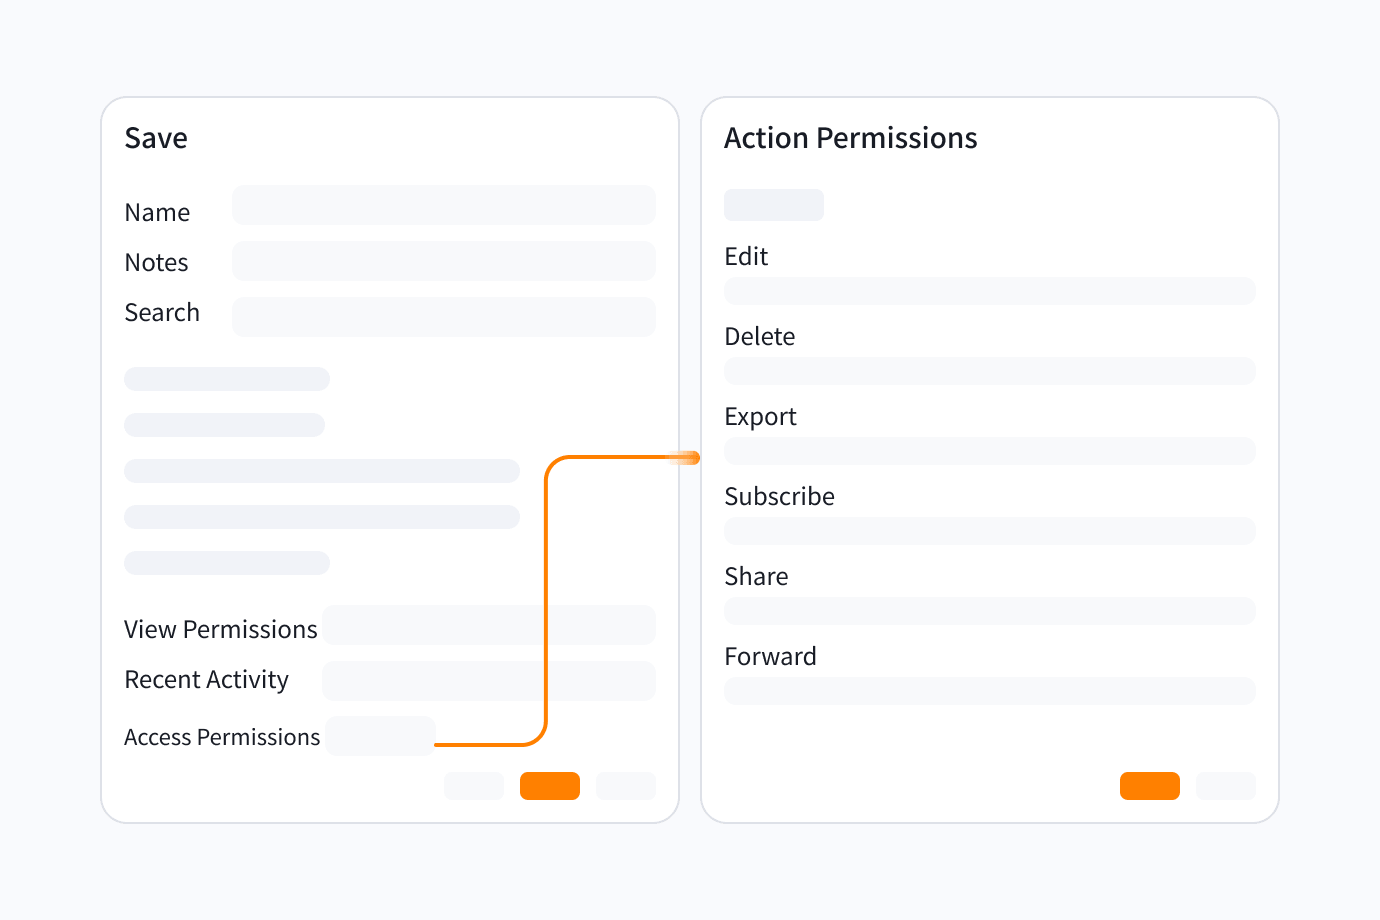
Field-level permission control means every user, team, and partner sees exactly the data they should — no more, no less. Share dashboards internally with a click, or extend a live, scoped view to distributors and channel partners without exposing anything behind it.
Built on the same platform and data your CRM already runs on.
BI runs on the same platform and data model as your CRM. Insight is live, not a nightly export that's stale by morning.
Conversational query and root-cause analysis are part of the platform — powered by the same agent runtime behind the rest of your CRM, not a separate product you integrate.
BI inherits the same PaaS permission model your CRM already runs on — set access once, and it applies to every report and dashboard automatically. One security perimeter, no shadow data.
We used to wait on the analytics team for every new question. Now our own ops team builds the report and gets the answer the same afternoon.
Ethan R.
VP · Consumer Goods
Self-service reporting adoption exceeded what we expected. Finance built 40+ reports themselves in the first quarter — no tickets to the data team.
Diana F.
Head of Sales Ops · Logistics
Field teams and channel partners see the same live numbers we do, scoped to what they should see. No more sharing screenshots or waiting on exports.
Patrick G.
Finance Director · High-Tech Manufacturing
Trusted by 7,000+ enterprises globally









Give every team clear, real-time insights to make faster decisions.